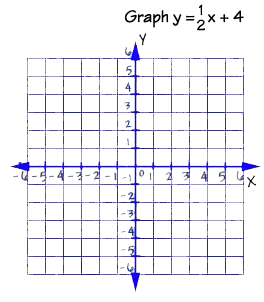
In order to graph a linear equation, we can use the slope and Y intercept to graph it, and visually show the data the formula states.
For this example, we have a formula of: Y=1/2x+4

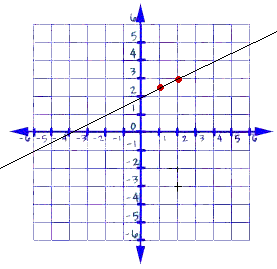
One way to graph it, is using the X and Y values of two points that satisfy the equation, plot each point and then draw a line through the points. You can start with any two x values you want, and then find "y" for each ''x'' by substituting the ''x'' values into the equations, Try it with X=1
If the value of x is one, and the formula is Y=1/2x+4, you should have written down "Y=1/2*1+2=1/2+2" Which then gives you a value of Y, which, after solving should be 2.5.
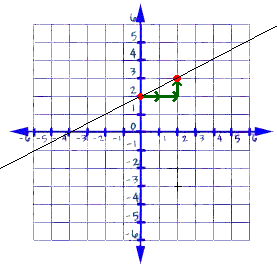
The "B" value in the equation can be used a start point for your graph, and then you can use rise over run to graph the lines.


You can also work backwords to find the equation from a graphed line,
Let's Practice
No comments:
Post a Comment